In this topic
  1. Configuring the Elevation Profile Widget
  2. Using the Elevation Profile Widget

Elevation Profile Widget 2.24

This widget allows you to measure a line on the map and get the elevation profile for that line based on the profile geoprocessing service supplied.
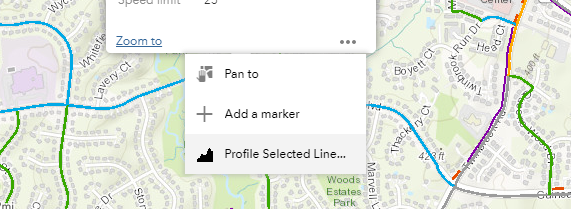
You can also select an existing line feature and in that lines popup menu you can choose "Profile selected line..."

Configuring the Elevation Profile Widget

  1. Hover the mouse over the Elevation Profile Widget and click the small edit icon edit icon.

    This opens the configuration window for this widget.
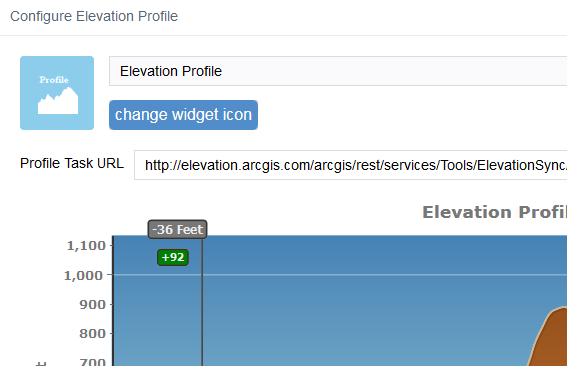
    Elevation Profile configuration

  2. Optionally, click change widget icon if you want to replace the default icon for this widget.

    A file explorer window opens allowing you to browse to a local image file to use as the widget icon.

  3. Optionally provide a different profile geoprosessing service task url. You would do this if you are seeking better resolution profiles. You can search esri blog for an article titled "setting-up-your-own-profile-service" on how to deploy your own profile geoprocessing service.
  4. Optionally provide a different widget width.
  5. Optionally click on the Edit Chart Display Properties link to change the appearance of the profile chart.
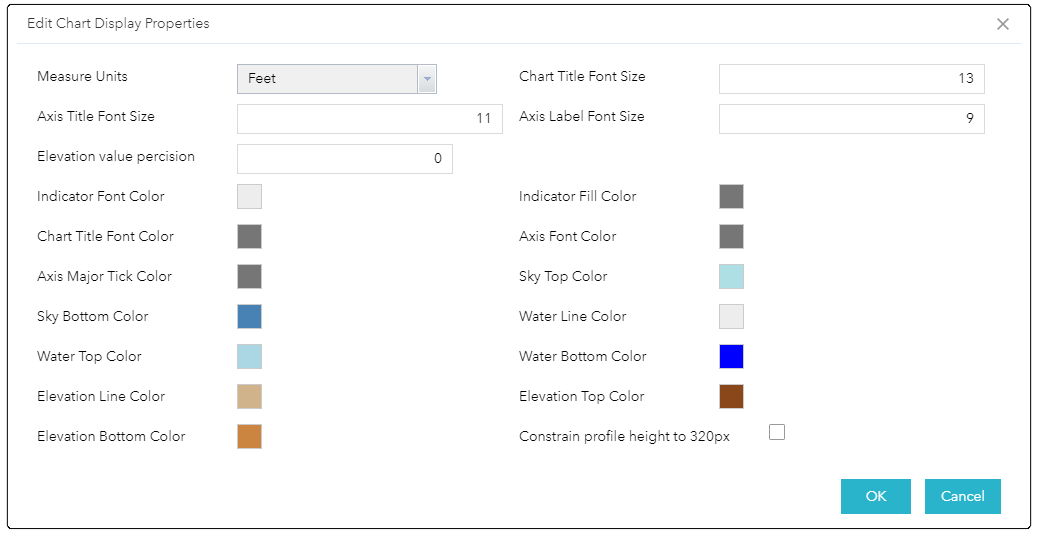
    Chart Display Settings

    All changes made in the Edit Chart Display Properties dialog can be seen in the preview chart once the ok button has been clicked on the Edit Chart Display Properties dialog.

  6. Optionally click on the Edit Default Line Symbol link to change the symbology of the line drawn on the map using the measure tool in this widget.
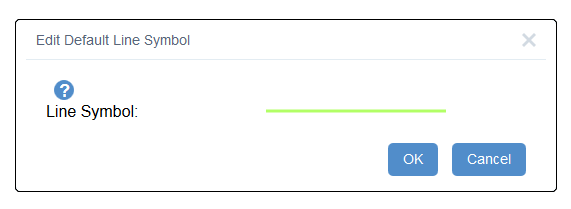
    Default Line Symbol Settings
  7. Optionally click on the Edit export profile csv output coordinate system link to change the coordinate system of the exported profiles csv file.

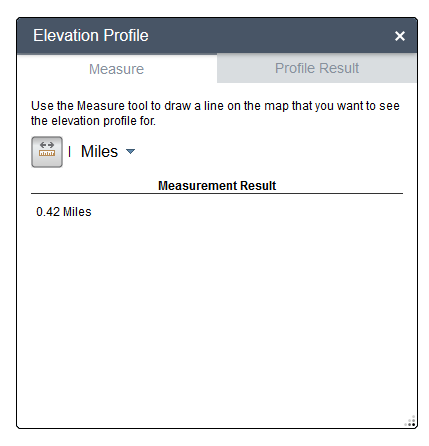
    Profiles csv export coodinates

Using the Elevation Profile Widget

Clicking the Elevation Profile Widget displays the widget.

Use Elevation Profile widget

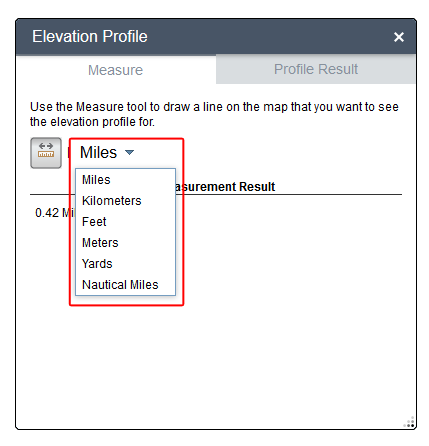
Select the measure units that you want to use for the line that you draw on the map or choose "Profile selected line..." from an existing lines popup menu.

Choose Distance Measurement Unit
Profile selected line

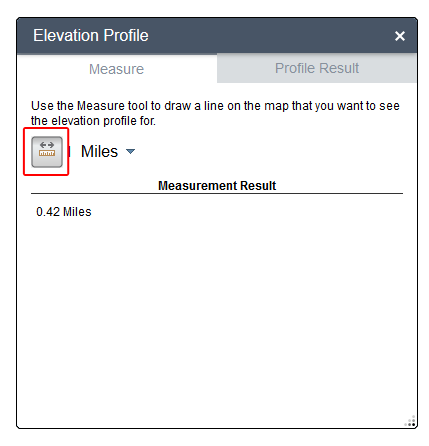
Next click on the distance measurement tool in the widget and draw a polyline on the map for the profile you wish to generate.

Select Measure Tool Draw Measure Line

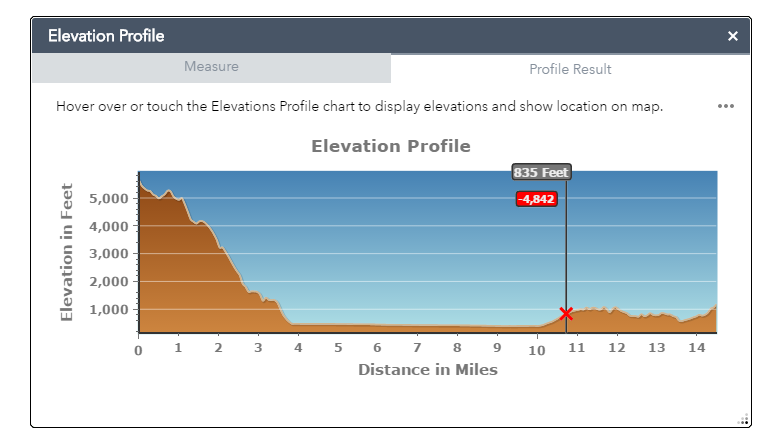
The results of the profile are then displayed in the widget.

Profile Chart Result

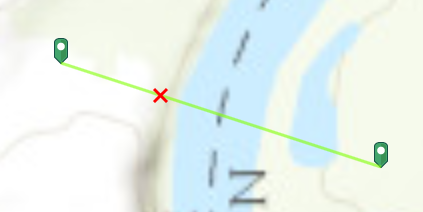
As you mouse over the chart in the widget a red x is moved in the map corresponding with the location in the chart.

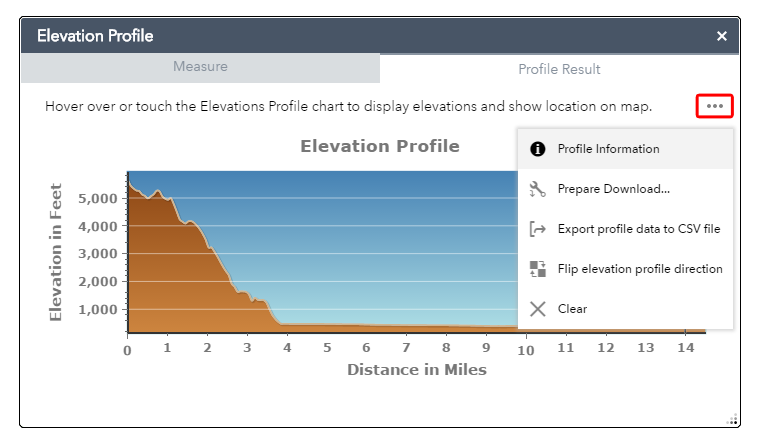
Clicking the Menu icon will show more options to interact with the eleveation profile.

Profile Chart Result

Menu Options

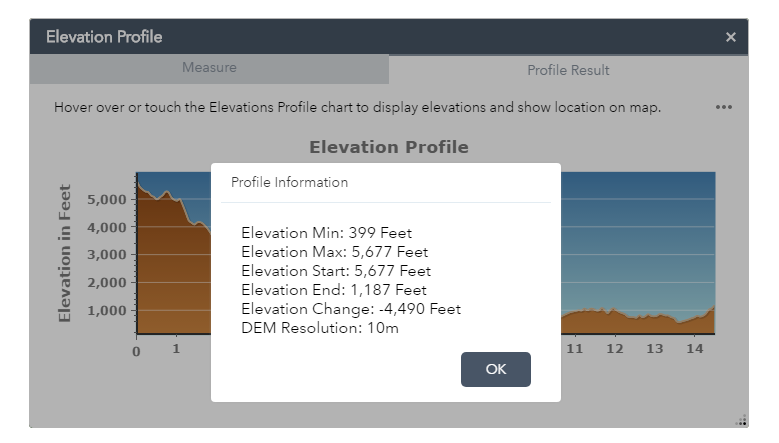
  1. Clicking the Profile Information menu option will display a message window with the elevation min, max, start, end change, and dem resolution info.
  2. Profile Chart Information
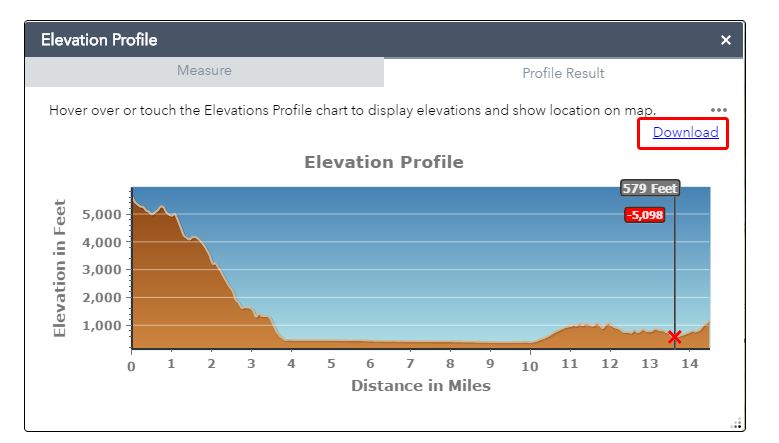
  3. Clicking the Prepare Download... menu option will prepare the profile image to be downloaded. Once preparation is complete the Download link will be visible on the widgets UI.
  4. Profile Chart Download
  5. Clicking the Export profile data to CSV file menu option will create and download the profile data (x, y, elevation and distance) to a csv file on the client.
  6. Clicking the Flip elevation profile direction menu option will take the existing profile and flip the begining and ending points showing the profile in reverse.
  7. Clicking the Clear menu option will clear the profile.